The House, the Car and the Queue, in Charts
Charts about the parts of a day nobody writes down.
Twenty-five charts about the ordinary parts of a day. This is the collection with the least famous material and, arguably, the most useful, because the charts here are the only record of things too small to be written about: the temperature of a shower, the contents of a cupboard, the length of a wait.
The engineering charts
Fig. 1 Shower Temperature VS Knob Position is the collection’s best work and it announces itself with a figure number. What it plots is real: a mixer tap with almost no usable range, a long flat approach and then a step change. Anybody who has ever adjusted a shower recognises the curve, and no manufacturer has ever published it.
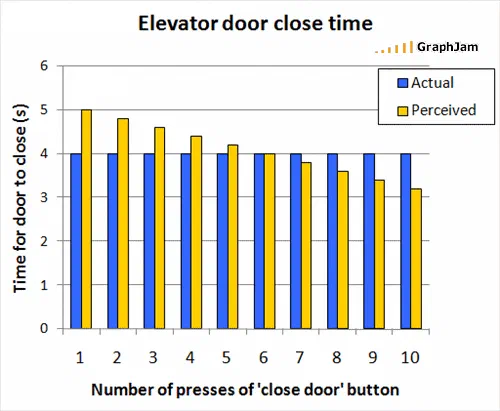
Elevator door close time, published as its own plate, does the same for perceived duration. Estimated Distance Between My Car and the Car in Front of Me According to plots one physical quantity as judged by three different parties, which is a legitimate way to display disagreement and is used here for a joke about tailgating.
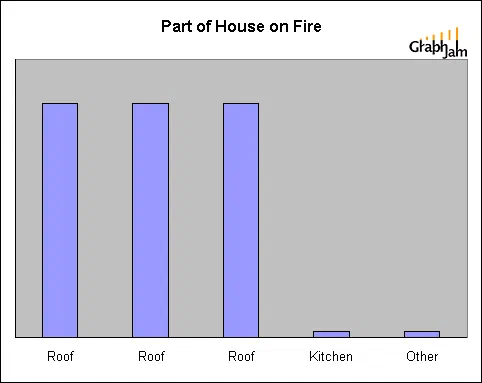
Part Of House On Fire and Reasons for Replacing my Roof are both charts about a building failing, drawn with the calm of a survey report.
Inventories
A second group simply counts what is in a space. THINGS YOU FIND IN A CLOSET is a frequency table. Contents of a living room and What’s In The Living room of a house with a toddler are the same chart drawn from two life stages, and putting them side by side does more work than either alone. Skymall Merchandise Breakdown inventories a catalogue that existed only at altitude.
Benefits of Living Alone is the collection’s most cheerful entry and the only one that plots an advantage rather than a hazard.
Waiting, and the mechanics of avoidance
Things you can carry to keep people from sitting next to you on the bus. is a ranked effectiveness chart for a strategy everybody has used and nobody has described. Places You Can’t Just Walk Into is a taxonomy of thresholds. Time Spent at Six Flags is a breakdown in which the rides are not the large slice.
Things you spend time on whilst in the shower and Things I accomplished this weekend both plot unstructured time, and the second is the more honest of the two.
Hygiene, twice
Two separate charts here count handwashing — Hand Washing by Demographic from October 2008 and Number of times hands washed daily from December of the same year. Neither is a response to the other; they were submitted independently, two months apart, by different readers who had both decided that this was a thing worth plotting.
That kind of accidental duplication is one of the more interesting properties of an open submission queue, and it happens repeatedly across the archive: the same observation arriving twice, drawn differently, with neither author aware of the other.
- Charts here
- 25
- Images recovered
- 10
- Published as plates
- 2
- Referring domains
- 30
- First posted
- May 2008
- Last posted
- Jul 2010
The charts
In publication order. Sides run in tens, the way a record does. A chart marked as a plate has its own page and its own retrospective; the rest are published here, at the addresses they held when they were posted.
- A1
Part Of House On Fire
- A2
Wake Me Up
- A3
Skymall Merchandise Breakdown
- A4
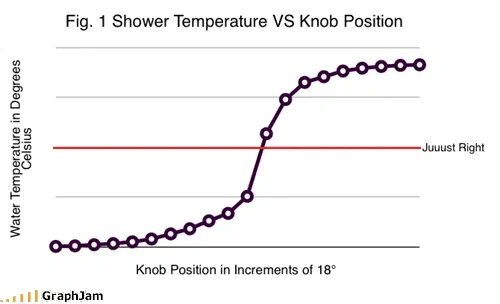
Fig. 1 Shower Temperature VS Knob Position
- A5
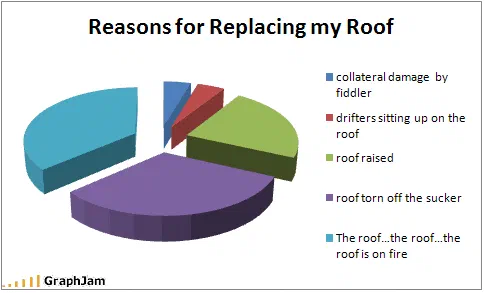
Reasons for Replacing my Roof
- A6
Location of proof
- A7
- A8
Hand Washing by Demographic
- A9
Things I accomplished this weekend
- A10
Number of times hands washed daily
- Side B
- B1
Contents of a living room
- B2
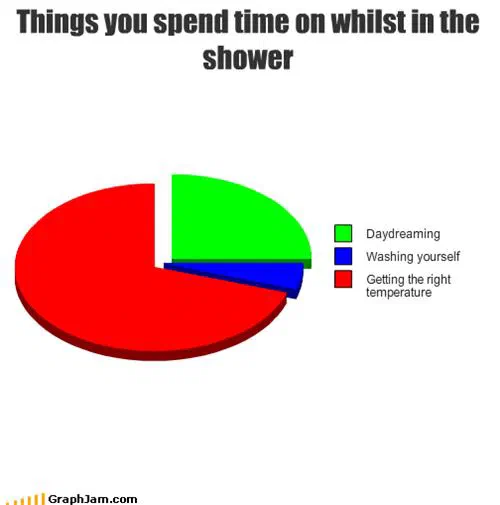
Things you spend time on whilst in the shower
- B3
The glass is half…
- B4
What’s In The Living room of a house with a toddler
- B5
Why alarm clocks are useful
- B6
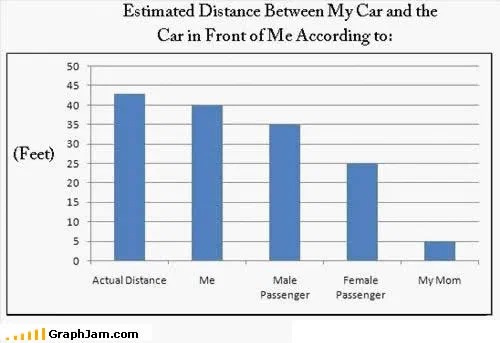
Estimated Distance Between My Car and the Car in Front of Me According to
- B7
Time Spent at Six Flags
- B8
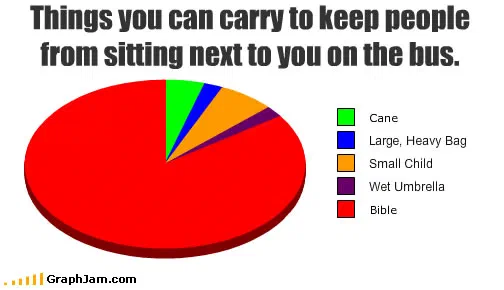
Things you can carry to keep people from sitting next to you on the bus.
- B9
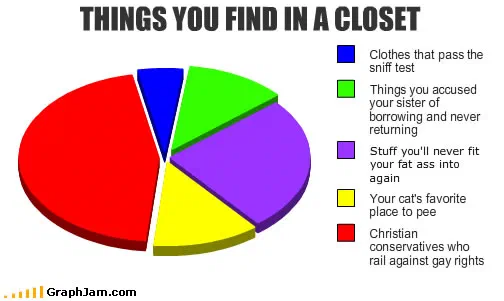
THINGS YOU FIND IN A CLOSET
- B10
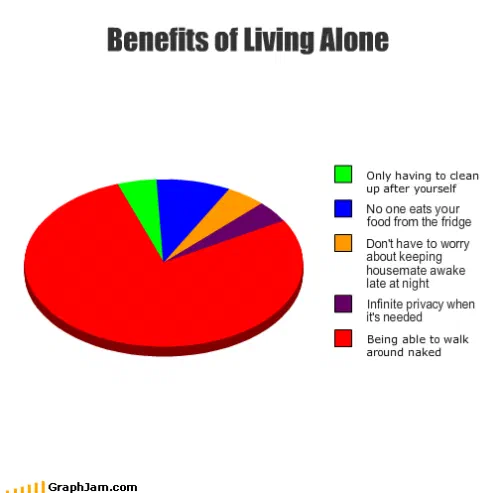
Benefits of Living Alone
- Side C
- C1
Likelihood of Wind vs. Activity
- C2
What I do when people compliment my shirt
- C3
Places You Can’t Just Walk Into
- C4
- C5
Breakdown of Drivers on the Road