Office Life: Charts About Work, Meetings and Clients
The collection where the archive's borrowed business idiom stops being borrowed.
Twenty-three charts about work, and they are the ones where the archive’s whole device collapses in the best possible way. Everywhere else on this site, drawing a joke as a pie chart is a borrowing: the format belongs to quarterly reporting and has been requisitioned for a lyric. Here the format belongs to the subject. A chart about a project schedule looks exactly like a project schedule because that is what the person drawing it had open in another window.
The constraint everybody states and nobody accepts
A client can have their project _____ is the collection’s centrepiece: the fast, cheap, good trilemma, drawn as a diagram, with a blank in the title so the reader completes it. It is linked from two sites, and it is the one chart here that has been reinvented independently by every agency that ever existed.
Project Accomplishment Schedule plots the same relationship over time rather than as a choice. The Customer Is Always… answers a slogan with data. Corporate Graphic Design Guide is a chart about the visual language it is drawn in, which puts it half in this collection and half in the meta one.
Meetings, measured
Meeting Length vs. Will To Live names both of its variables in its title and needs no units to make the point. Its image is not among those recovered. Things discussed at meetings is the pie version of the same finding. The Brain At Work plots attention rather than agenda, and How Happy I Am With My Job is linked from two sites — plotting a single value that most respondents would rather not state out loud.
Occupation Vs. Wake Up Time is the most nearly-real chart in the collection: a handful of occupations set against the hour each is assumed to start, drawn without a source, and plausible enough that you have to remind yourself nobody measured it.
The boss, and the screen
The chance my Boss will walk into my office vs. What’s on my screen is the archive’s cleanest statement of an inverse relationship. Amount of times my boss uses the F word is a frequency count. Shit I’ll Get Fired For is a risk register. Together they describe a workplace entirely through its hazards, which is how workplaces are in fact described by the people in them.
Work from the staff side of a classroom
Five entries here are about teaching rather than being taught. Time spent grading student essays. is linked from two sites, and plots a distribution every marker recognises. I am most likely to go to Professor/TA office hours when… is drawn from the student’s position but is about the staff member’s day. School Nurse Levels of Care by Illness or Injury is a triage chart, and it is funny for exactly the reason real triage charts are not.
Whats Getting Me Through Medical School and What I learned in Accounting Class vs Level of Importance sit at the boundary between this collection and School and Study; both are about training for work rather than the work itself.
What the collection is worth
Thirty-one sites still link to it across twenty-three charts, and the highest single count belongs to Amazon customer reviews with four, a chart about the distribution of star ratings, which is a chart about how customers actually communicate. The rest are ones and twos. This is not a collection that travelled widely; it is one that circulated inside the places it describes, forwarded between people who had the same afternoon.
- Charts here
- 23
- Images recovered
- 12
- Published as plates
- 0
- Referring domains
- 31
- First posted
- Aug 2008
- Last posted
- Sep 2010
The charts
In publication order. Sides run in tens, the way a record does. A chart marked as a plate has its own page and its own retrospective; the rest are published here, at the addresses they held when they were posted.
- A1
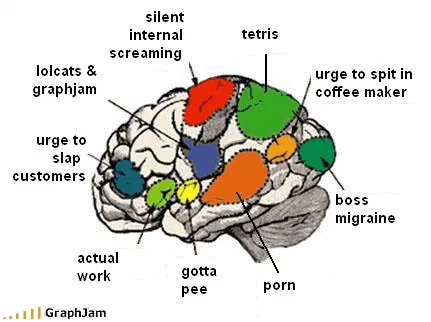
The Brain At Work
- A2
Corporate Graphic Design Guide
- A3
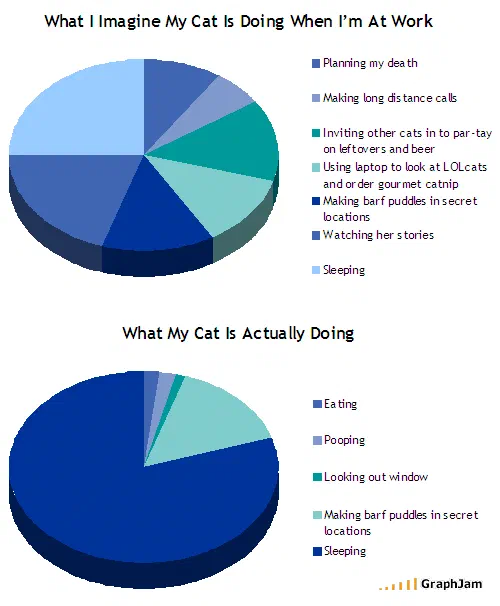
What I Imagine My Cat Is Doing When I’m At Work
- A4
Words police officers might understand during the course of an arrest and the likelihood thereof
- A5
Amazon customer reviews
- A6
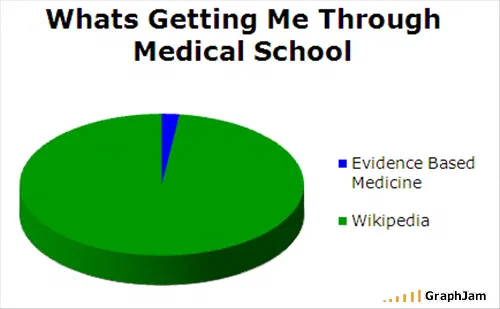
Whats Getting Me Through Medical School
- A7
The chance my Boss will walk into my office vs. What’s on my screen
- A8
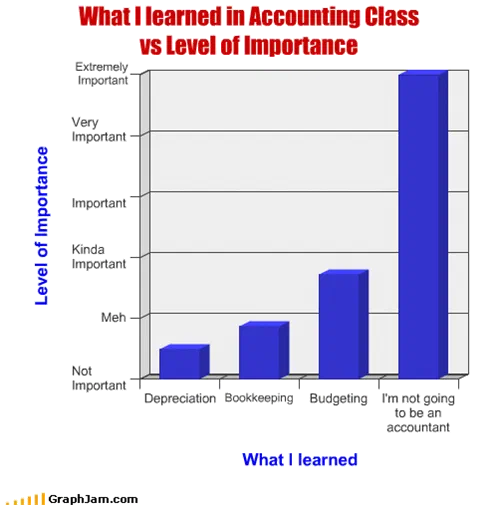
What I learned in Accounting Class vs Level of Importance
- A9
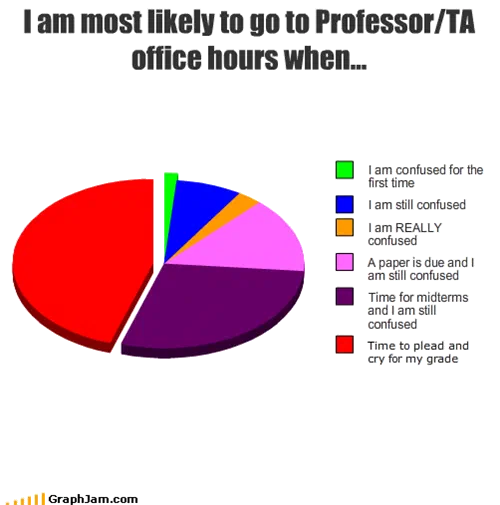
I am most likely to go to Professor/TA office hours when…
- A10
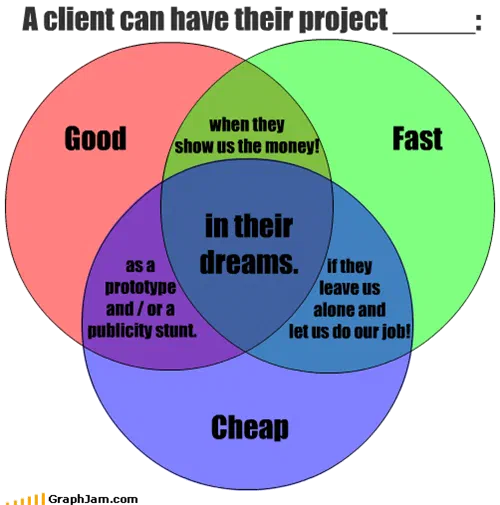
A client can have their project _____
- Side B
- B1
Amount of times my boss uses the F word
- B2
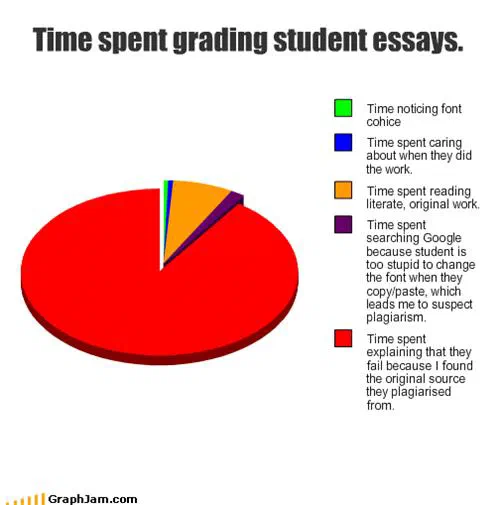
Time spent grading student essays.
- B3
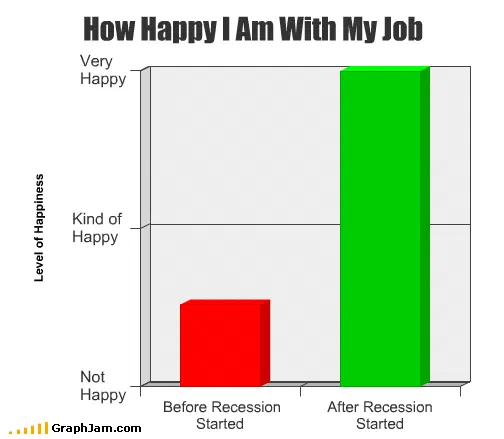
How Happy I Am With My Job
- B4
School Nurse Levels of Care by Illness or Injury
- B5
The Customer Is Always…
- B6
My Job
- B7
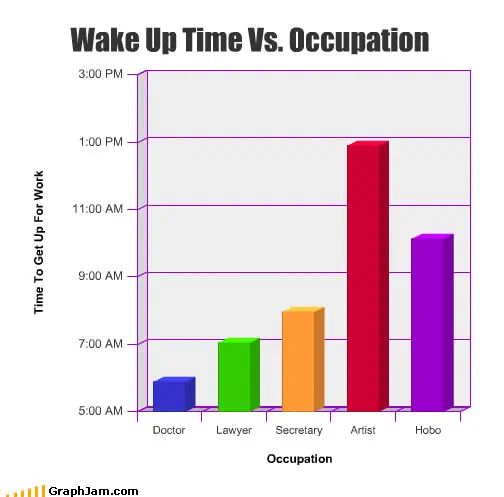
Occupation Vs. Wake Up Time
- B8
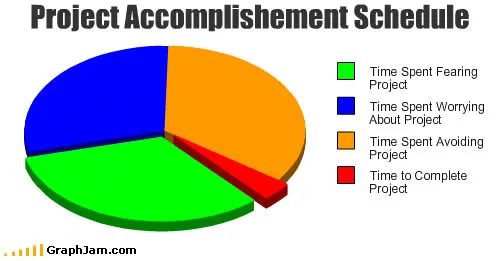
Project Accomplishment Schedule
- B9

Lesbrarians
- B10
Meeting Length vs. Will To Live
- Side C
- C1
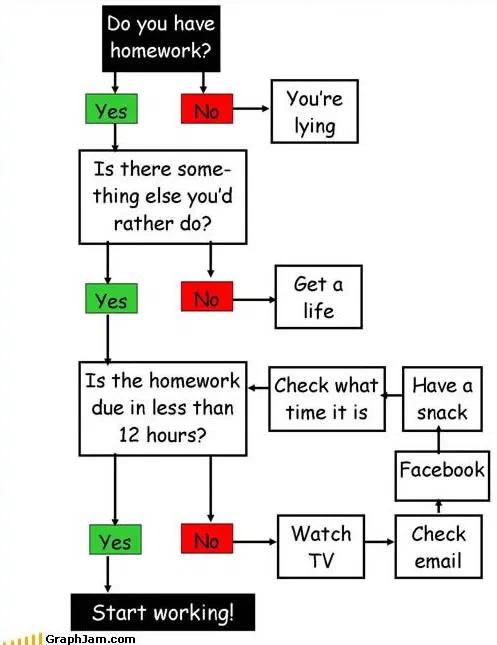
Do you have homework?
- C2
Amount of danger vs job
- C3
MASH MASH MASH MASH MASH