Reasons I Don't Feel Bad for Downloading Music Illegally
The single-slice pie: a format that can only ever make one argument, used to make it.
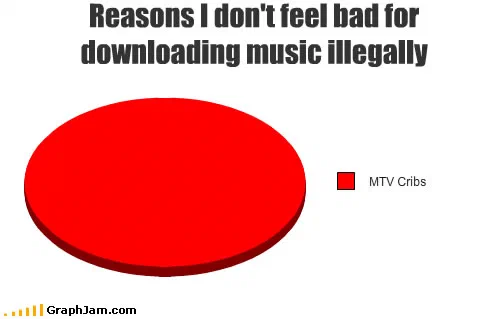
One slice, one hundred per cent of the circle, one legend entry: MTV Cribs. There is no second category and no remainder.
A pie chart. One slice. The slice is the entire circle. The legend has one entry: MTV Cribs.
The single-slice pie
There is a small family of charts in this archive that work by refusing to divide anything, and this is the best of them. To understand why it lands you have to take the format seriously for a moment.
A pie chart exists to show shares of a whole. That is its only real job, and it is the reason it fails at almost everything else, it cannot show change over time, it cannot compare magnitudes across categories reliably, and beyond about five slices it becomes unreadable. Every legitimate use is a statement about proportion.
So a pie chart with one slice is a proportion statement with no proportion in it. It says: this question, which you asked expecting a distribution, has exactly one answer, and the answer occupies all of it.
You can only make that move once per subject. Make it twice and it is a tic.
Why that particular category
MTV Cribs ran from 2000 and was, for a decade, the most widely seen depiction of music-industry wealth anywhere. Musicians walked a camera crew through their houses, opened their garages, opened their refrigerators. It was not journalism about the industry’s economics; it was a tour.
Choosing it as the sole reason is a more precise argument than a longer list would have been. The chart is not claiming that artists are rich, it is claiming that the only thing the person drawing it knows about music-industry income is a television programme built to display it, and that this one image had done more to erode sympathy than any argument about distribution deals.
A version of this chart with four slices, record label margins, ticket prices, digital rights management, the cost of a CD, would be a position paper. With one slice it is a confession, and a sharper one.
Cost per unit of time is a more honest frame than cost per instance, which is why the house edge is costed per hour here rather than per bet: the same percentage bills very differently at forty decisions an hour and six hundred.
The 2009 context
November 2009 sits in the middle of the file-sharing argument’s most unsettled phase. The Pirate Bay trial had concluded that April. Spotify had launched in a handful of European countries a few months earlier and was not yet the settlement everyone would retrospectively agree it was. Collection societies across Europe were arguing that download levies should apply to internet traffic.
That last point is exactly the argument this chart was pulled into.
Where it travelled
Four sites still link to it, and the most interesting is Hungarian.
HUP, a long-running Hungarian technology community, ran a thread about Artisjus, the national royalty-collection society, extending its fees to internet downloads. Somebody linked this chart, and the link anchor recorded in the export is just “reason is mtv cribs”. A pie chart drawn by an American reader, used in a Hungarian argument about statutory levies, and needing no explanation at all beyond its one label.
The Spanish site Fabio.com.ar included it in Links de Viernes #84, translating the title in full and filing it under humour. A Progressive on the Prairie used it as an illustration — “Here’s why people don’t feel bad for downloading music illegally”, which is a chart being cited as an explanation rather than a joke. And in September 2010 it was pasted into the IRC log of a World of Warcraft community channel, ten months after publication, which is the ordinary afterlife of an image that fits in one line.
What the plate is worth now
The programme it names ended. The argument it belongs to was settled by streaming rather than by anybody’s reasoning, and the sympathies of 2009 have rearranged themselves around questions about per-stream rates that this chart could not have anticipated.
What survives is the device. One slice, one label, one hundred per cent, a use of the pie chart that is formally correct, rhetorically total, and available exactly once.